TRIR vs LTIFR vs DART: Which Safety Metric Should You Report?
Few things confuse a safety report faster than a table of injury rates that nobody has defined. One site reports a TRIR of 1.8, another an LTIFR of 2.4, a contractor quotes a DART rate of 0.9 — and the board concludes that one of them is performing badly. In reality they may be measuring completely different things.
This guide explains what each of the three most common lagging indicators measures, how to calculate them, and how to use them without drawing the wrong conclusion.
The short answer
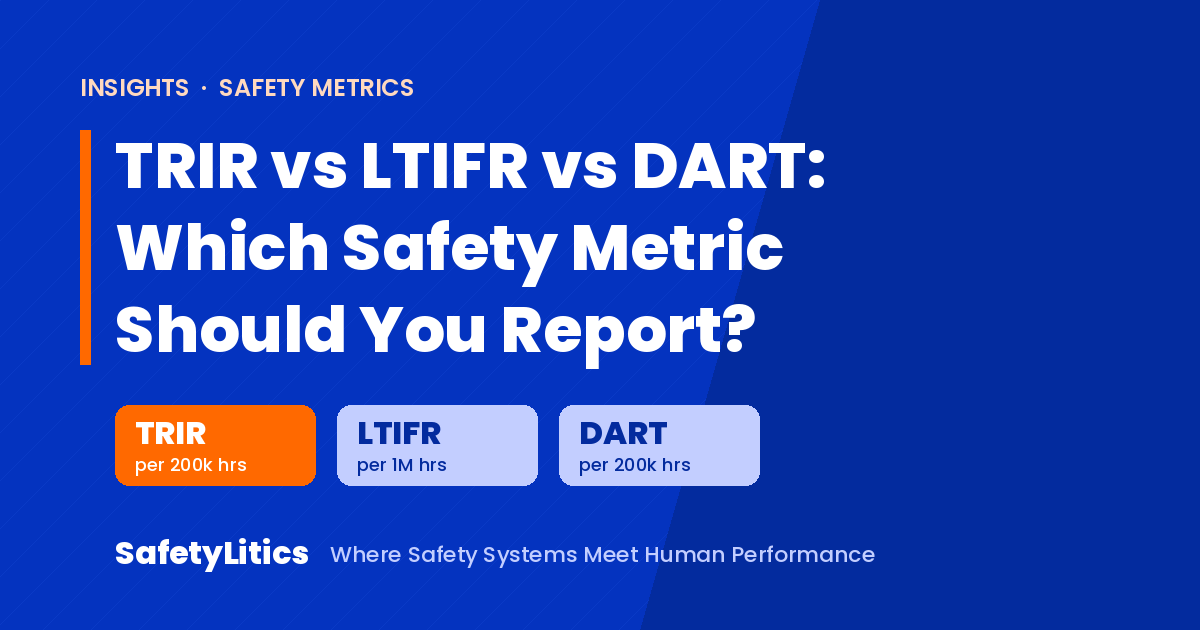
- TRIR counts OSHA-recordable injury and illness cases per 200,000 hours. It is the broadest of the three and is widely used in the United States and in reporting to US-based clients.
- LTIFR counts only lost-time injuries, usually per 1,000,000 hours. It is commonly used in international reporting, particularly in sectors such as energy, mining and construction.
- DART counts recordable cases that caused days away, restricted work or a job transfer, per 200,000 hours. It focuses on cases that affected the employee’s ability to do their normal work.
TRIR: Total Recordable Incident Rate
Formula: TRIR = (recordable cases × 200,000) ÷ total hours worked.
A case is recordable under the US OSHA recordkeeping rule when a work-related injury or illness results in death, days away from work, restricted work or transfer, medical treatment beyond first aid, or loss of consciousness, among other criteria — including certain significant diagnosed injuries and illnesses. The 200,000-hour base corresponds to 100 full-time employees working 2,000 hours each per year, so TRIR reads roughly as “cases per 100 workers per year”.
Because it includes medical-treatment cases, TRIR is sensitive to how an organisation manages the boundary between first aid and treatment — a common source of distortion when rates are tied to bonuses. Calculate your TRIR →
LTIFR: Lost Time Injury Frequency Rate
Formula: LTIFR = (lost-time injuries × 1,000,000) ÷ total hours worked.
A lost-time injury is generally an injury that leaves the worker unable to perform their normal work beyond the day of the injury. However, there is no single universal definition: organisations and reporting frameworks differ, particularly in how they treat fatalities, occupational illness and restricted work. Always publish the definition you use alongside the number.
LTIFR is useful for comparing against international peers, but it only captures injuries serious enough to stop work. Depending on the definition used, an injured person who returns on restricted duties may not count as a lost-time case at all — so LTIFR can fall without anything becoming safer. Calculate your LTIFR →
DART rate: Days Away, Restricted or Transferred
Formula: DART rate = (DART cases × 200,000) ÷ total hours worked.
DART is a subset of recordables: it focuses specifically on recordable cases involving days away, restricted work or job transfer, so it adds information about the impact of an injury or illness on work. Unlike a lost-time-only measure, DART also captures qualifying cases of restricted work or job transfer, although not every informal “light duty” arrangement meets OSHA’s definition of restricted work — classification should follow the applicable rules. When calculated using the same OSHA recordkeeping definitions and population, the DART rate cannot exceed the TRIR. Calculate your DART rate →
Side by side
| TRIR | LTIFR | DART | |
|---|---|---|---|
| Counts | All recordables | Lost-time injuries | Days away, restricted, transferred |
| Usual base | 200,000 hours | 1,000,000 hours | 200,000 hours |
| Most common in | US and US-linked reporting | International reporting; energy, mining, construction | US, contractor prequalification |
| Main weakness | Sensitive to first-aid vs treatment classification | Definitions vary; restricted work may be excluded | Still says nothing about potential severity |
The comparison mistake that misleads boards
The single most common error is comparing rates calculated on different bases. The same performance produces a number five times larger per million hours than per 200,000 hours. An LTIFR of 1.0 per million hours equals 0.2 per 200,000 hours. Before comparing any two figures, confirm they use the same definition and the same multiplier.
What none of these metrics tell you
All three are lagging indicators: they count harm that has already happened. They say little about the risk of a serious injury or fatality. Many organisations with excellent TRIR have still suffered fatal events, because the precursors of serious incidents are often different from those of minor ones.
That is why mature organisations pair lagging rates with a severity rate, near-miss reporting (our near-miss ratio calculator is one simple way to track it, though there is no universally standardised near-miss rate), high-potential incident tracking and leading indicators such as the quality of critical-control checks. A low injury rate is welcome — but it is not proof that your major risks are under control.
Which should you report?
Report what your stakeholders and regulators expect — often TRIR for US-linked clients and LTIFR in international reporting — and add DART or a severity measure for a fuller picture of impact. Most importantly, state definitions and bases clearly, track trends over time, and never let a single rate stand in for an assessment of risk.
If you want help building an indicator set that tells leadership the truth about risk, see our assurance services or book a free strategy session.